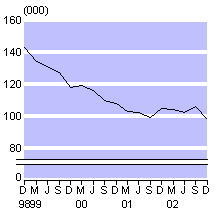
OFFICIAL RATE OF UNEMPLOYED
December 2002 seasonally adjusted
4.9%
OR ONE IN 20 PEOPLE
DROP IN NUMBER OF UNEMPLOYED
IN LAST THREE
MONTHS
September 2002 to December 2002
8,000 people
.
DROP IN NUMBER OF UNEMPLOYED
IN THE LAST YEAR
December 2001 to December 2002
7,000 people
Source — Statistics NZ
OFFICIALLY UNEMPLOYED IN THE REGIONS
December 2002 |
| NORTHLAND |
8.5% |
or one in 12 people |
| AUCKLAND |
4.0% |
or one in 25 people |
| WAIKATO |
5.4 |
or one in 19 people |
| BAY OF PLENTY |
6.6% |
or one in 15 people |
| GISBORNE - HAWKES BAY |
5.7% |
or one in 18 people |
| TARANAKI |
5.5% |
or one in 18 people |
| WANGANUI - MANAWATU |
3.8% |
or one in 26 people |
| WELLINGTON |
5.0% |
or one in 20 people |
| NELSON - MARLBOROUGH TASMAN - WEST COAST |
4.1% |
or one in 24 people |
| CANTERBURY |
4.2% |
or one in 24 people |
| OTAGO |
5.3% |
or one in 19 people |
| SOUTHLAND |
3.9% |
or one in 26 people |
| Source — Statistics NZ |
REGIONS WITH A DROP IN UNEMPLOYMENT
IN THE LAST THREE MONTHS
September 2002 to December 2002
Auckland
Taranaki
Wanganui/Manawatu
Bay of Plenty
Canterbury
Otago
REGIONS WITH NO CHANGE IN UNEMPLOYMENT
Waikato
REGIONS WITH A RISE IN UNEMPLOYMENT
Northland
Gisborne/Hawkes Bay
Wellington
Nelson/Marlborough/
Tasman/West Coast
Southland
Registrations at Ministry of Social Development
(formerly Winz)
PEOPLE REGISTERED AS JOB SEEKERS
WITH MINISTRY OF SOCIAL DEVELOPMENT
December 2002
168,337
NOTIFIED VACANCIES
for month of December 2002
Figures Unavailable
Source — Ministry of Social Development
The Underemployed
December 2002
113,000 people
According to Statistics NZ, the underemployed are workers who are employed part time but would prefer to work more hours
The Employed
NUMBER OF PEOPLE IN JOBS IN NEW ZEALAND
December 2002 seasonally adjusted
1,886,000 people
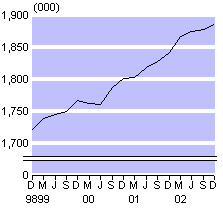
RISE IN THE NUMBER OF PEOPLE IN JOBS IN LAST 3 MONTHS
September 2002 to December 2002
8,000
RISE IN THE NUMBER OF PEOPLE IN JOBS IN LAST YEAR
December 2001 to December 2002
44,000 people
SECTORS WITH A RISE IN EMPLOYMENT IN LAST YEAR
Wholesale & Retail Trade, Construction, Education, Business & Financial
SECTORS WITH A DROP IN EMPLOYMENT IN LAST YEAR
Agriculture, Forestry & Fishing, Manufacturing, Health & Community Services,Transport, Storage & Communication,
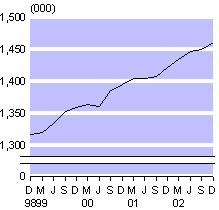
Full-time and Part-time
GAIN IN FULL-TIME EMPLOYED
IN THE PAST YEAR
December 2001 to December 2002
40,000 people
Full Time Employment
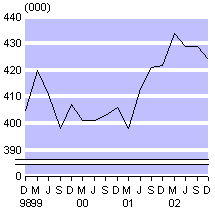
GAIN IN PART-TIME EMPLOYED
IN THE PAST YEAR
December 2001 to December 2002
2,000 people
Part Time Employment
| ... |
Full-time |
Part-time |
|
Men |
924,300 (89%) |
114,000 (11%) |
|
Women |
556,000 (64%) |
310,800 (36%) |
|
Total |
1,480,300 |
424,800 |
|
Overall % |
78% |
22% |
| Source — Statistics NZ |
Global Unemployment Rates
SPAIN
12.0%
ITALY
8.9%
FRANCE
8.9%
GERMANY
8.5%
CANADA
7.5%
OECD AVERAGE
7.1%
AUSTRALIA
6.2%
UNITED STATES
6.0%
JAPAN
5.5%
BRITAIN
5.1%
NEW ZEALAND
4.9%
Officially Jobless
"Those without a job
and wanting a job ..."
These are the statistics that are more commonly used
by community workers and employment activists in New
Zealand because they more accurately reflect the
people who are their concern or clients.
These "Jobless" figures are also based on the
Household Labour Force Survey run by Statistics NZ,
but include a wider definition of unemployment,
usually referred to "those without a job and wanting
a job".
ONE IN TWELVE PEOPLE OFFICIALLY JOBLESS IN NZ
According to Statistics NZ, the difference between
the official "unemployment" figures and the "jobless
figures" is that many of the people on the jobless
measurement are available for work, but not actively
seeking it.
The reasons for not actively seeking work range from
people being discouraged because they lack the skills
needed, or were the wrong age, or that the right work
was not available in their area, or they were only
looking for jobs in their newspaper. This measurement
also includes those actively seeking work but not yet
available for it.
OFFICIAL NUMBER OF JOBLESS IN NZ
December 2002
172,600 people
OFFICIAL RATE OF JOBLESS
December 2002
8.3%
OR ONE IN 12 PEOPLE
DROP IN NUMBER OF JOBLESS
IN LAST THREE
MONTHS
September 2002 to December 2002
4,000
DROP IN NUMBER OF JOBLESS
IN THE LAST YEAR
December 2001 to December 2002
11,000 people
Source — Statistics NZ
JOBLESS IN THE REGIONS
December 2002 |
| NORTHLAND |
14.0% |
or one in 7 people |
| AUCKLAND |
6.8% |
or one in 15 people |
| WAIKATO |
9.3% |
or one in 11 people |
| BAY OF PLENTY |
11.1 |
or one in 9 people |
| GISBORNE - HAWKES BAY |
12.2% |
or one in 8 people |
| TARANAKI |
9.6% |
or one in 10 people |
| WANGANUI - MANAWATU |
6.9 |
or one in 14 people |
| WELLINGTON |
8.4% |
or one in 12 people |
| NELSON - MARLBOROUGH TASMAN - WEST COAST |
6.6% |
or one in 15 people |
| CANTERBURY |
7.2% |
or one in 14 people |
| OTAGO |
10.9% |
or one in 9 people |
| SOUTHLAND |
7.0% |
or one in 14 people |
| Source — Statistics NZ |
Labour Force Participation Rate
LABOUR FORCE PARTICIPATION RATE
December 2002
66.3%
Labour Force Participation Rate
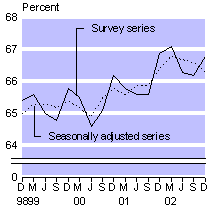
Source — Statistics NZ
Race / Ethnic
MAORI RATE OF UNEMPLOYMENT
December 2002
11.4%
or one in 9 Maori people
PACIFIC ISLAND RATE OF UNEMPLOYMENT
December 2002
8.2%
or one in 12 Pacific Island people
NZ EUROPEAN (PAKEHA) RATE OF UNEMPLOYMENT
December 2002
3.3%
or one in 30 NZ European (Pakeha) people
Unemployment Rate
By Ethnic Group
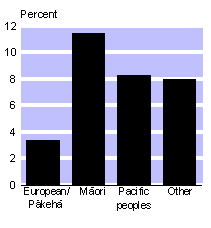
Source — Statistics NZ
Age Rates and Long-term Unemployment
YOUTH UNEMPLOYMENT RATE
-- AGED 15-19 YEARS
December 2002
16.0%
or one in 6 young people
MATURE UNEMPLOYMENT RATE
-- AGED 50-65 YEARS
December 2002
3.2%
or one in 31 mature people
LONG-TERM UNEMPLOYED (over 6 months)
December 2002
25,500 people
26% or one in 4 of the unemployed
LONGER-TERM UNEMPLOYED (over 2 years)
December 2002
5,400 people
6% or one in 18 of the unemployed
VERY LONG-TERM UNEMPLOYED (over 5 years)
December 2002
1,500 people
2% or one in 65 of the unemployed
Source — Statistics NZ
The Schemes and Subsidised Jobs
|
TASKFORCE GREEN |
407 |
|
JOB PLUS |
3,217 |
|
JOB PLUS MAORI |
87 |
|
JOB CONNECTION |
86 |
|
ENTERPRISE ALLOWANCE |
48 |
ENTERPRISE ALLOWANCE
with capitalisation |
273 |
TRAINING OPPORTUNITY PROGRAMME
(TOPS) COURSES) |
7,824 people |
|
YOUTH TRAINING (T.E.C.) |
5,490 people |
LIMITED SERVICE VOLUNTEERS
(Army) |
76 people |
|
CONSERVATION CORPS |
825 people |
|
YOUTH SERVICE CORPS |
126 people |
ACTIVITY IN THE COMMUNITY
(still counted as unemployed) |
786 |
Source — figures from Ministry of Social Development (formerly Work & Income NZ),Tertiary Education Commission (formerly Skill NZ) and Youth Affairs


